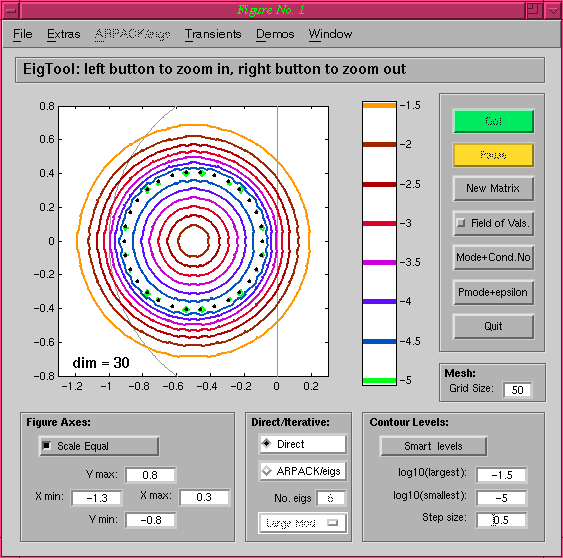

Note that the imaginary axis and unit circle are shown: these can be
turned on using the menu options.
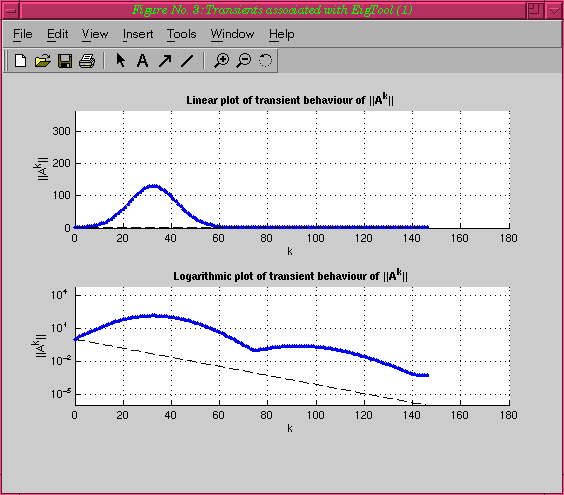
Although the largest eigenvalue (in absolute value) predicts the
decay given by the black dashed line (it is inside the unit circle),
the norm of the powers grows over one hundredfold before
decaying as expected from the spectral radius [abscissa].
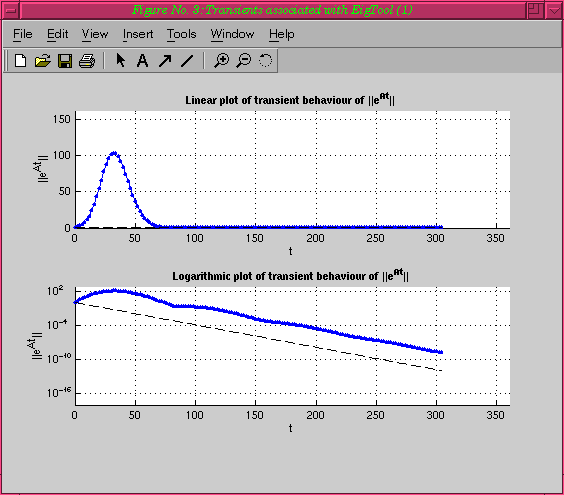
Although the largest real part of an eigenvalue predicts the decay
given by the black dashed line (it is in the left half-plane), the
norm grows over one hundredfold before decaying according to the
theory.
For matrix powers:
max{1<=k<=K}||A^k|| >=
r^K/(1+(r^K-1)/((r-1)*(rR-1))) For matrix exponentials:
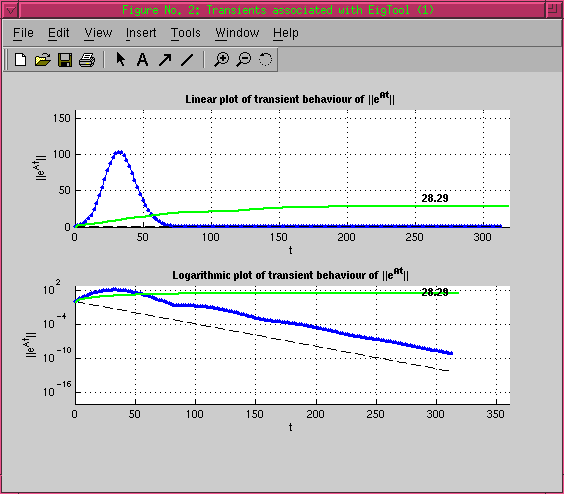
sup{0<=t<=T}||exp(t*A)|| >=exp(a*T)/(1+(exp(a*T)-1)/(aR)) Clicking on a point near z=0.2 gives the following plot:
The bound appears as a green curve on the transient plot (with the
selected point highlighted on the pseudospectra plot). For any
particular point on this curve at step K (or time T), the bound says
that the transient growth must have been at least this large for some
point k < K (or t < T).
[1]: L. N. Trefethen, 2002, unpublished note
In general, this bound is usually within an order of magnitude of
the true growth.
EigTool home page.
Matrix Powers
If we look at the norms of the powers of this matrix, we get the
following plot after a few seconds of computation:

Matrix Exponentials
If we look at the norms of the matrix exponential exp(t*A) for various
values of t, we get the
following plot after a few seconds of computation. When prompted, we
chose a time step dt=2:

Compute a Bound
Using pseudospectra, it is possible to compute lower bounds on the
size of this transient growth. After selecting this option, you will
be asked to click on a point in the complex plane to base the bound
upon; the bound is then computed as follows [1], where R is the resolvent
norm at the selected point z. The bound will be computed over the
values of k (or t) currently visable on the transient plot
(only valid for |z| = r > 1).
(only valid for Re(z) = a > 0).

Best Estimate Lower Bound
As well as allowing the user to select a point to base their bound
upon (see Compute a Bound), a best
estimate of the lower bound over all of the points in the grid
used for the current pseudospectra can be computed:
